•Diagnostic tools are instruments or techniques used to identify problems or faults in a system, process or device.
•It is used to assess the status, performance and health of a system or component and to diagnose and troubleshoot issues.
•It may be software programs, hardware devices, sensors, etc.
•It analyses data, measure parameters, monitor performance and then generate reports.
Windows OS Diagnostic Tools
Windows OS Diagnostic Tools are a set of built-in features that can help diagnose and troubleshoot problems on our computer.
Task Scheduler
•Task Scheduler is a built-in Windows tool that allows us to schedule automated tasks and scripts to run on our computer at specific times or in response to specific events
•With Task Scheduler, we can automate routine tasks, such as backups, system maintenance and software updates.
•We can create and manage tasks using the Task Scheduler user interface or the command-line tool, schtasks.exe
•We can trigger tasks to run in response to specific events, such as system startup, user login, or a specific event in the event log.
•We can set conditions for a task to run, such as if the computer is idle or if a network connection is available.
•We can specify the action or actions that a task will perform such as running a script, launching an application, sending an email or displaying a message.
•We can monitor the status of scheduled tasks and view detailed information about their performance and execution history.
HOW TO OPEN
•Type “ Task Scheduler” in the Taskbar search box.
•Select Task Scheduler from the menu
•Click on “Task Scheduler” from the search results
•——————————————————————————————-
•Press the Windows key + R to open the Run dialog box.
•Type taskschd.msc and press Enter or click OK.
•——————————————————————————————-
•In Task Scheduler console, display the Task Scheduler Library on the left pane and the details of the selected task or folder on the right pane.
EVENT VIEWER
•Event viewer is a built-in Windows tool that allows you to view detailed information about system events, application events and security events that occur on our computer.
•These events can include errors, warnings and informational messages and Event viewer provides a centralized location for monitoring and troubleshooting them.
•Event viewer allows you to view events logs, which are organized by type of event (system, application, security), severity and source.
•We can filter events by time range, event type, source and event ID to find specific events or types of events.
•We can create custom views that display only the events you are interested in, based on specific criteria.
•We can attach tasks to events to automate troubleshooting or perform other actions when certain events occur.
•We can export event to a file which can be useful for sharing with others or for further analysis.
•This tool can be used for identifying security issues, monitoring system and application performance.
How to Open :
•Press the Windows key + R to open the Run dialog box
•Type eventvwr.msc and press Enter or OK
•—————————————————————————————-
•Type Event Viewer in the search bar Click on Event Viewer from the search box.
SHARE FOLDER
•A shared folder is a directory on a computer or network that is accessible to multiple users and devices.
•Sharing a folder allows other users to access and edit files within that folder.
How to create :
•Create a new folder on your computer or select an existing folder that you want to share
•Right-click on the folder and select “Properties”.
•Click on the “Sharing” Tab
• Click the “Share” button.
•In the “Share with” box, select the users or groups you want to share the folder with.
•Click the “Add” button to add users or groups.
•In the “Permission Level” column, select the appropriate level of permission for each user or group.
•Click “Share” to create the shared folder.
•Now user from network location can open the folder and edit the files within it, depending on their level of permission.
•It is essential only to share folders with trusted users and to set appropriate permissions for each user or group.
DISK MANAGEMENT SERVICE
•Disk Management is a built-in Windows tool that allows you to manage the storage devices attached to it.
•Storage device includes hard drives, SSDs, USB drives and more.
•Before we can use a new disk, we need to initialize it. Disk Management allows us to do this quickly and easily.
•After initializing a disk, we can create one or more partitions on it and format them to use them for storage.
•Disk Management also extend or shrink an existing partition to change its size without losing data.
•We can change the drive letter of a volume or partition to make it easier to identify and access.
•If we need to set up software RAID or use other advanced features, we can convert a Basic disk to a Dynamic disk using Disk Management.
•We can assign a volume amount point or remove one, to create a path to a drive or partition.
•Disk Management provides detailed information about our disks, including their size, file system type, and available space.
MEMORY DIAGNOSTIC
•Memory Diagnostic is a built-in Windows OS tool that allows us to test the memory of our computer.
•Memory Diagnostic can be used to detect hardware issues with our computer’s memory.
•If our computer is facing crashes or system errors, it could be due to a hardware issue with our memory.
•And running Memory Diagnostic can help us to identify and resolve these issues.
•Running Memory Diagnostic in a new memory installed in computer, we can check whether it is functioning properly or not.
•Memory Diagnostic can be used to optimize system performance by identifying and resolving memory related issues.
•Memory Diagnostic can be used to troubleshoot software issues that may be caused by faulty memory.
•Running Memory Diagnostic can check if any crashes or errors with a specific application and that is due to a memory issue.
•Memory Diagnostic can be used to prevent data loss by identifying and resolving memory issues before they cause data corrupt or loss.
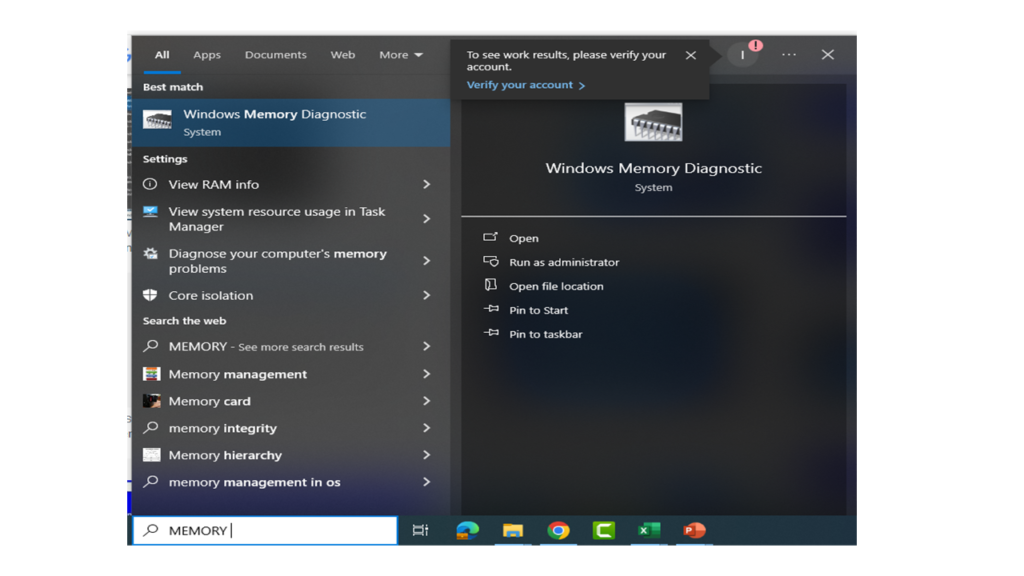

HOW TO TEST RAM WITH WINDOWS MEMORY DIAGNOSTIC TOOL
•Open the Start with menu and type “Windows Memory Diagnostic” in the search bar.
•In the Windows Memory Diagnostic tool, select the option to restart the computer and run the tool immediately or to run the tool on the next reboot.

During the restart process, the tool will run and check the RAM for errors

•If any errors are found, the tool will display a message informing you of the errors.
•If you encounter errors, it is recommended that you replace the faulty RAM module.
WINDOWS OS DIAGNOSTIC RESOURCE
•Windows OS has many built-in diagnostic commands.
•We can use those to troubleshoot and diagnostic system issues.
Perfmon command & Perfmon report
•Perfmon à Performance Monitor
•It is also a built-in Windows OS tool.
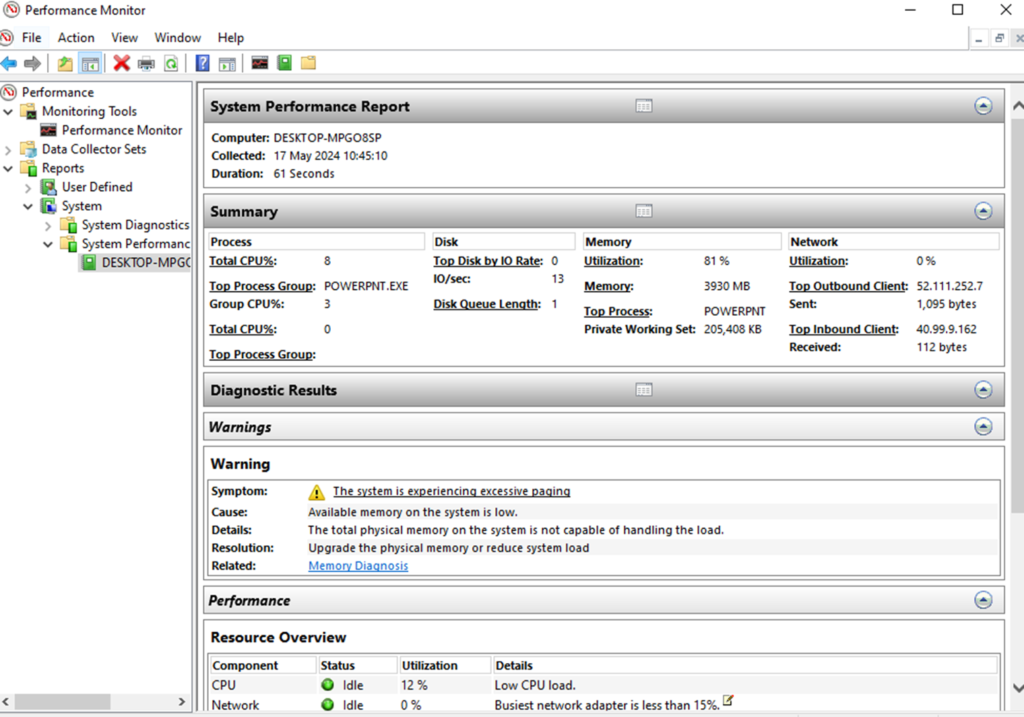
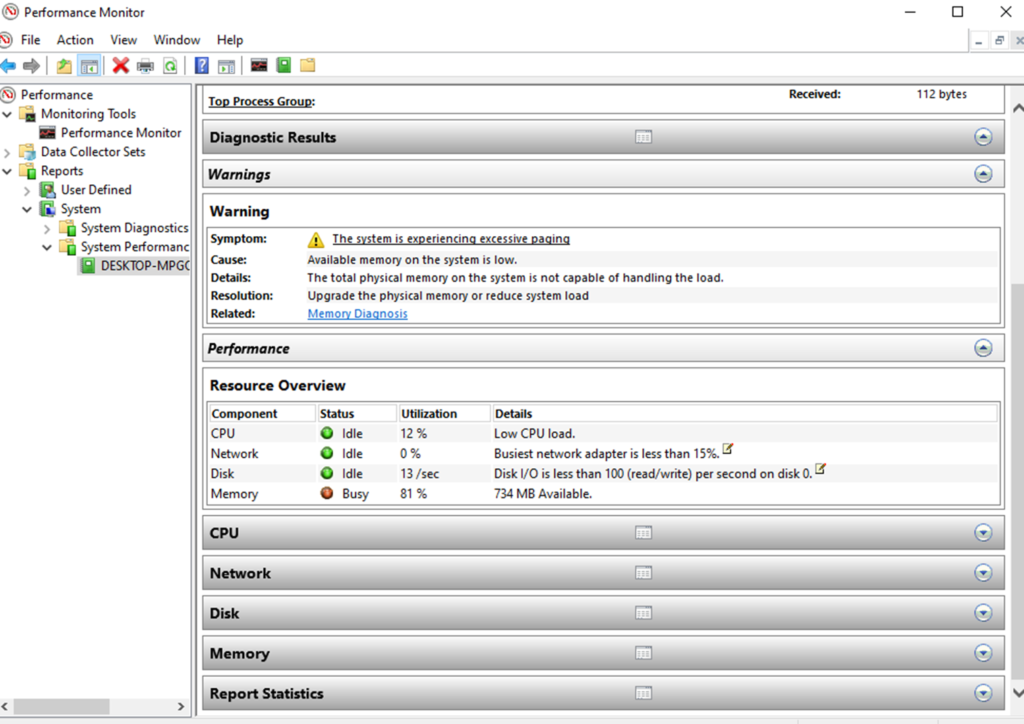
•It is used to monitor and analyse system performance.
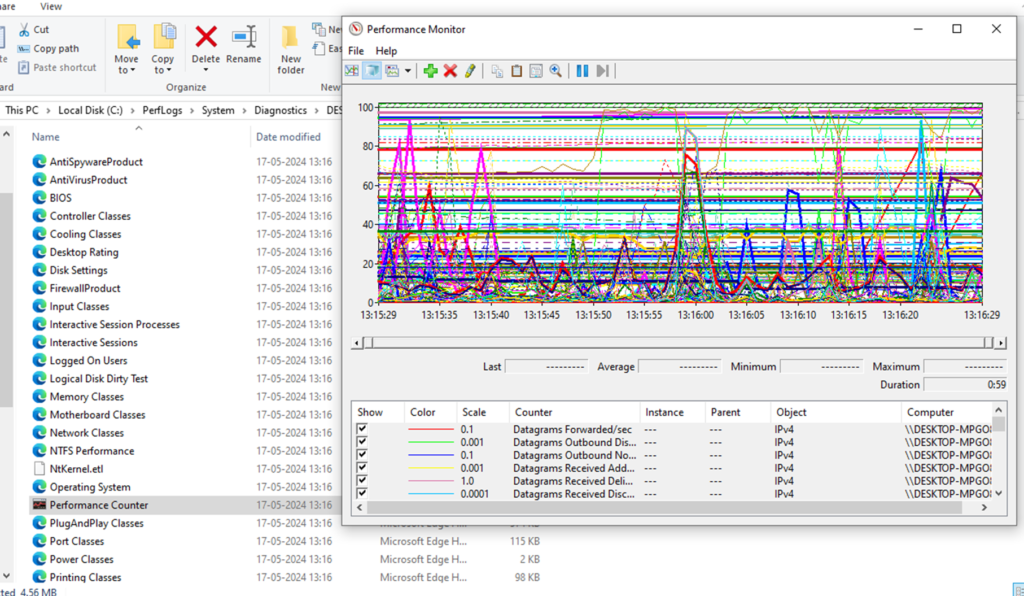
•It provides real-time information about system resource usage, means CPU utilization, memory usage, disk activity and network performance.
•From the start menu, open the Run dialog box.
•Type “perfmon” and press enter to open the Performance Monitor.

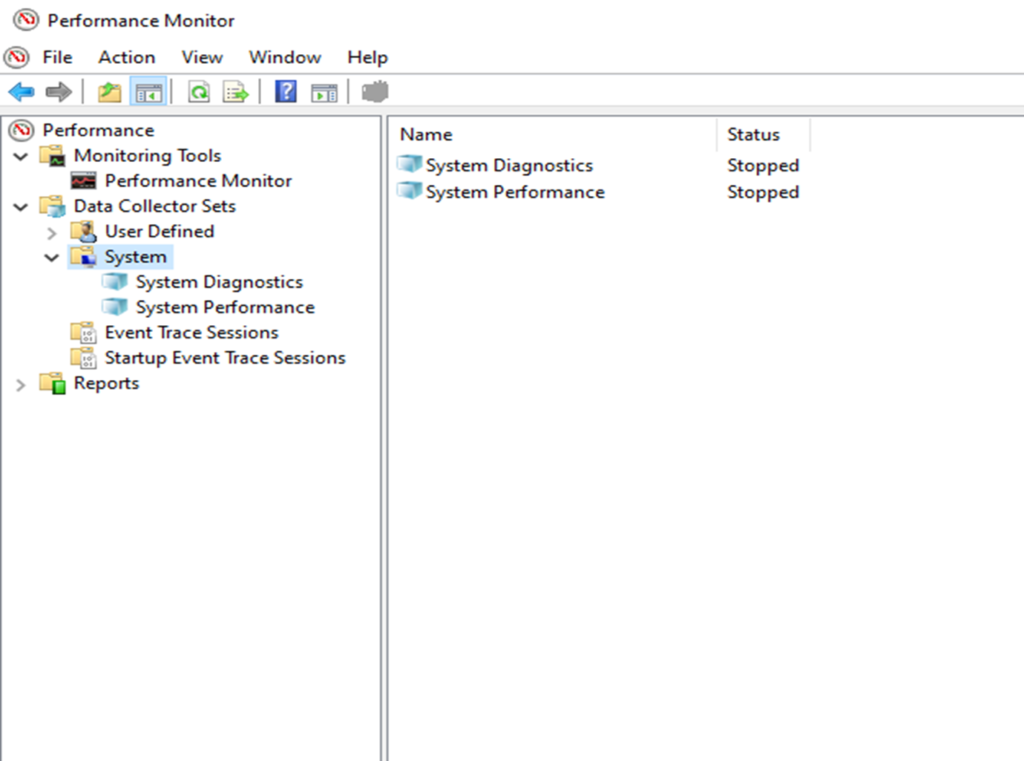
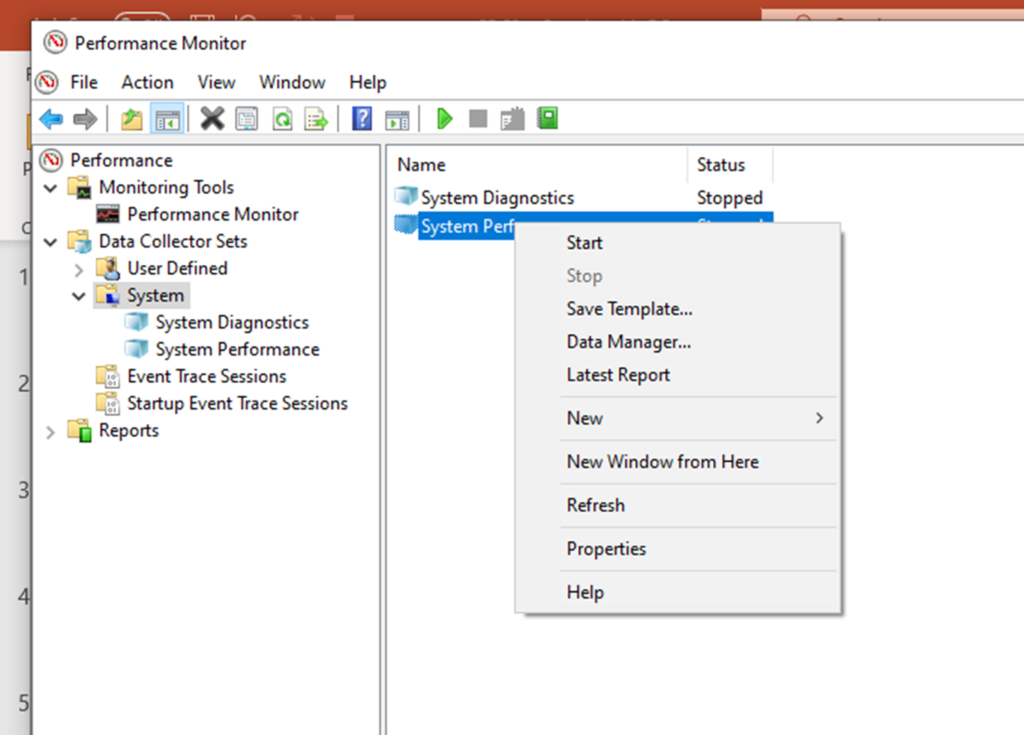
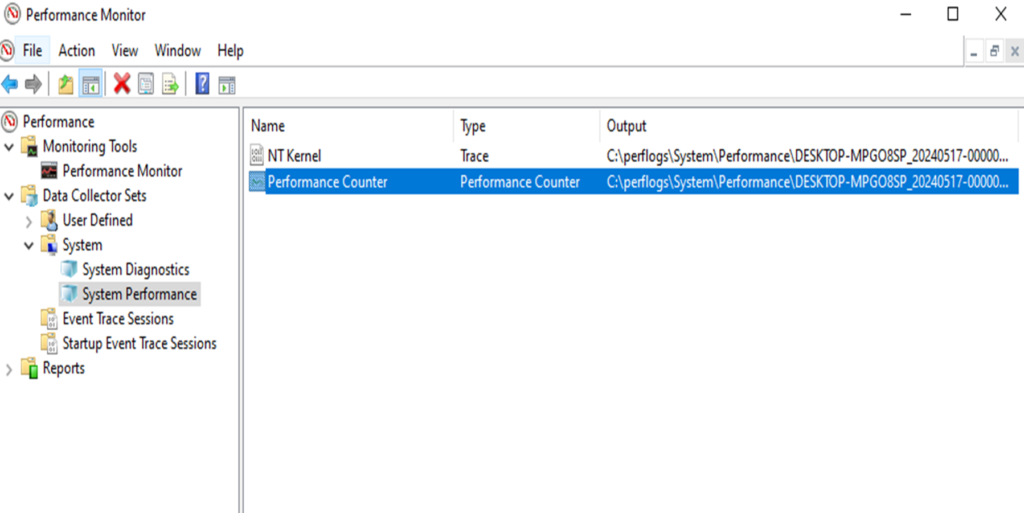
After clicking on the start button, the “report collects the data for 60 seconds” to generate the performance report



•The ‘mdsched’ command is a Windows utility used to check for memory problems on a computer.
•It is a part of Windows Memory Diagnostic Tool.
•It is a built-in feature in Windows operating system.
•The ‘mdsched’ command can be used to lunch the Windows Memory Diagnostic Tool from the command prompt.


